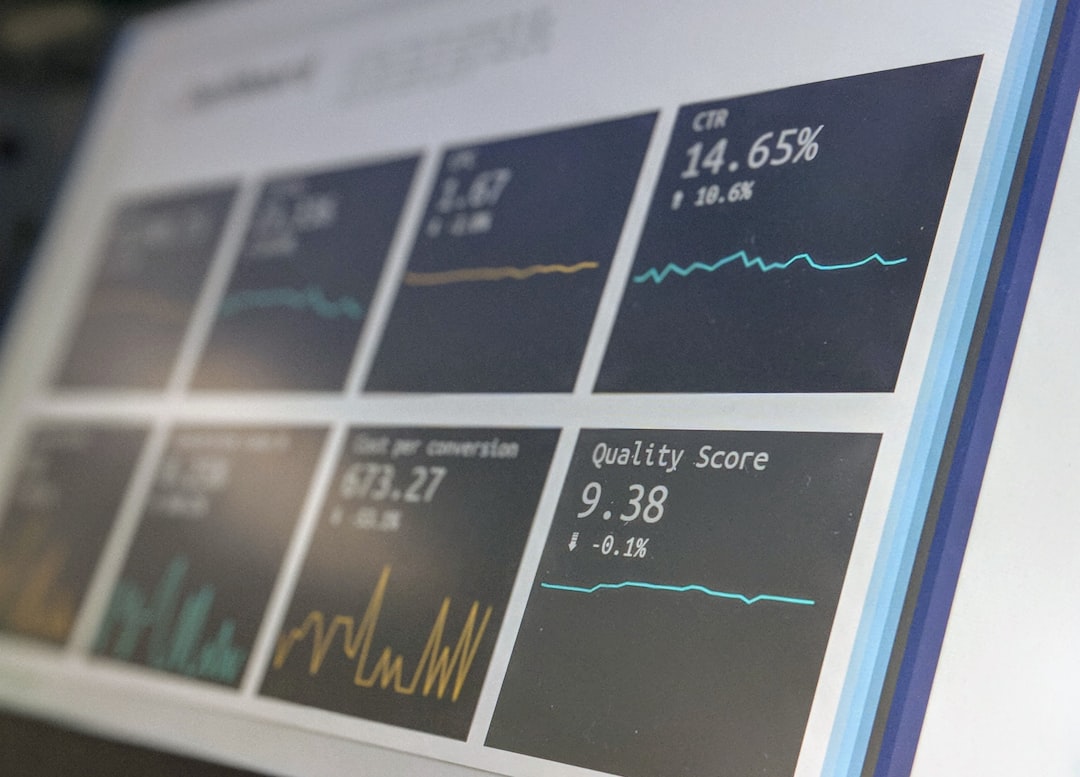


Beyond Vanity Metrics: Unlocking True Facebook Ad Profitability
As an independent agency, every dollar spent on advertising needs to work harder. You’re not just looking for clicks or impressions; you’re hunting for tangible business results. Facebook Ads Manager, with its vast array of metrics, can feel like navigating a labyrinth. While some numbers are easy to grasp (like reach), others are crucial for determining if your campaigns are actually making you money – or bleeding it.
This guide cuts through the noise. We’ll focus on the key metrics that reveal true profitability, moving beyond vanity numbers to help you make smarter, data-driven decisions. Forget simply looking at cost per click (CPC) or click-through rate (CTR) in isolation. We’re diving deep into how these connect to your bottom line.
The Core Metrics for Measuring Facebook Ad Profitability
To understand if your Facebook ads are profitable, you need to look at the entire customer journey, from impression to conversion and beyond. Here are the essential metrics, and how they tie together:
1. Cost Per Acquisition (CPA) / Cost Per Lead (CPL)
This is arguably the most critical metric for profitability. CPA tells you exactly how much it costs to acquire one paying customer through your Facebook ad campaign. CPL is similar but measures the cost of acquiring a lead (someone who has expressed interest but hasn’t purchased yet).
- Why it matters: If your CPA is higher than the profit you make from that customer, you’re losing money. If your CPL is higher than the lifetime value (LTV) you can attribute to a lead, your lead generation efforts are unsustainable.
- Realistic Example: Let’s say you sell a product for $100, and your profit margin after all costs (product, shipping, overhead) is $40. If your Facebook Ads Manager shows a CPA of $50, you’re losing $10 on every sale generated through that ad. If your CPA is $30, you’re making $10 profit per sale. You need to aim for a CPA significantly below your profit margin per customer.
- Pro Tip: Ensure your conversion tracking is set up correctly. Without accurate data on actual purchases or qualified leads, your CPA will be misleading.
2. Return on Ad Spend (ROAS)
ROAS is a direct measure of revenue generated for every dollar spent on advertising. It’s calculated as:
ROAS = Total Revenue from Ads / Total Ad Spend
- Why it matters: A ROAS of 3:1 means that for every $1 you spend on ads, you generate $3 in revenue. This is a clear indicator of profitability. A ROAS below 1:1 signifies you’re losing money.
- Realistic Example: You spent $1,000 on Facebook ads this month. Those ads drove $4,000 in sales. Your ROAS is 4:1 ($4,000 / $1,000). This campaign is profitable. If you only generated $800 in sales, your ROAS is 0.8:1, and you’ve lost money.
- The Nuance: ROAS measures revenue, not profit. A high ROAS is great, but if your profit margins are razor-thin, a 4:1 ROAS might still not be enough to cover all your business expenses. This is why understanding your profit margin is crucial when interpreting ROAS.
3. Customer Lifetime Value (CLTV) vs. CPA
While CPA tells you the cost of acquiring a single customer, CLTV estimates the total revenue a customer is expected to generate throughout their relationship with your business.
- Why it matters: For businesses with repeat customers or subscription models, a higher CPA might be acceptable if the CLTV is significantly higher. This metric helps you understand the long-term viability of your customer acquisition strategy.
- Realistic Example: Your CPA for a new customer is $60. This sounds high if your first purchase profit is only $40. However, if your customer data shows that, on average, customers make three purchases over their lifetime, generating $150 in profit, then a $60 CPA is highly profitable. You’re investing $60 to get $150 in profit over time.
- Practical Detail: Calculating CLTV requires robust data tracking beyond just initial purchase. You need to track repeat purchases, subscription renewals, and average order value over time. This often involves integrating your CRM or e-commerce platform data with your analytics.
Beyond the Numbers: Context is Key
Simply tracking these metrics isn’t enough. You need to understand the context and how they interact.
The Role of Conversion Rate
Your conversion rate (CR) is the percentage of users who take a desired action (e.g., purchase, sign-up) after clicking your ad. A low CR can inflate your CPA, even if your CPC is low. Improving your landing page, ad creative, or targeting can significantly boost CR and, consequently, lower your CPA and improve ROAS.
The Impact of Ad Frequency
Frequency is the average number of times a unique person has seen your ad. While seeing an ad multiple times can increase brand recall, a very high frequency (e.g., above 5-7 within a short period) can lead to ad fatigue, annoyance, and diminishing returns. If your frequency is high and your CPA is increasing or ROAS is dropping, it’s a strong signal to refresh your ad creative or adjust your targeting.
Understanding Your Sales Funnel
Are you tracking leads or direct sales? The metrics you prioritize will differ. For lead generation campaigns, focus on CPL and the quality of leads (which often requires input from your sales team). For direct sales, CPA and ROAS are paramount. It’s also crucial to consider the time lag between a click and a conversion. A customer might see your ad today but purchase next week. Ensure your attribution window in Facebook Ads Manager aligns with your typical sales cycle.
A Deeper Dive: The Unseen Costs and Opportunities
Here’s where many agencies falter: overlooking the finer details that impact true profitability.
1. Hidden Costs in Your CPA Calculation
Your true CPA isn’t just what Facebook Ads Manager reports. It needs to account for:
- Product/Service Cost: The direct cost of goods sold.
- Operational Overhead: A portion of your rent, utilities, salaries, software subscriptions (like HC Invoice!).
- Payment Processing Fees: Typically 2-3% of the transaction value.
- Shipping/Fulfillment Costs: For e-commerce.
- Return/Refund Costs: Factor in the percentage of returns.
Realistic Scenario: Facebook reports a CPA of $40. You sell a product for $100 with a stated profit of $50. But when you add in payment processing fees ($2.50), shipping ($10), and a conservative 5% return rate (costing $5 per order on average), your actual profit per acquired customer drops to $32.50. This makes that $40 CPA much less appealing, potentially even a loss.
2. The Power of Post-Purchase Behavior
Profitability isn’t just about the first sale. What happens after the purchase? Are customers returning? Are they upgrading? Are they referring others? While not directly shown in basic Ads Manager reports, these behaviors drastically impact the CLTV and the overall success of your ad spend. A campaign that brings in customers who churn quickly is ultimately unprofitable, even if the initial CPA looks good.
3. Attribution Models: Beyond Last Click
Facebook Ads Manager offers various attribution windows (e.g., 7-day click, 1-day view). If you’re solely looking at a 1-day click attribution, you might be undervaluing campaigns that influence sales through multiple touchpoints or via view-through conversions. For a more accurate picture of your true ROI, consider exploring different attribution models within Ads Manager and comparing them to your Google Analytics data. Understanding how different channels contribute to a conversion is vital for holistic campaign assessment. For instance, a customer might see your Facebook ad (view), then later search on Google and click a non-branded ad (Google Ads) to convert. A last-click model would attribute this sale solely to Google Ads, ignoring Facebook’s influential role.
Making Informed Decisions
Reading Facebook Ads Manager metrics effectively is about connecting the dots. It’s about understanding your business’s financial realities and how ad spend contributes to them. Don’t get lost in the sheer volume of data. Focus on CPA, ROAS, and CLTV in relation to your profit margins and overall business goals.
By looking beyond surface-level metrics and understanding the true costs and long-term value, you can confidently determine which campaigns are driving actual profit and which need optimization or a complete overhaul. This data-informed approach is what separates agencies that merely spend money from those that generate significant returns for their clients.
Ready to ensure your advertising investments are consistently profitable? Let’s talk about how HC Invoice can help streamline your financial tracking and provide the clarity you need to make smarter marketing decisions. Contact us today for a consultation.
Photo by Alex Haney on Unsplash